
Key results summary
During 2025, we acquired 67 parking facilities with 36,088 parking spaces, bringing our total portfolio to 5,573 parking facilities with 1,237,940 parking spaces (2024: 5,506 and 1,201,852 respectively).
Note: We have adjusted the reported portfolio numbers for 2024 to now include the SAGS acquisition which was completed in December 2024.
Mobility transition and liveability services include transforming search traffic into destination traffic by our 619 parking facilities offering online pre-booking (2024: 510).
And we have identified more than 150 parking facilities which fit our Mobility Hub definition.
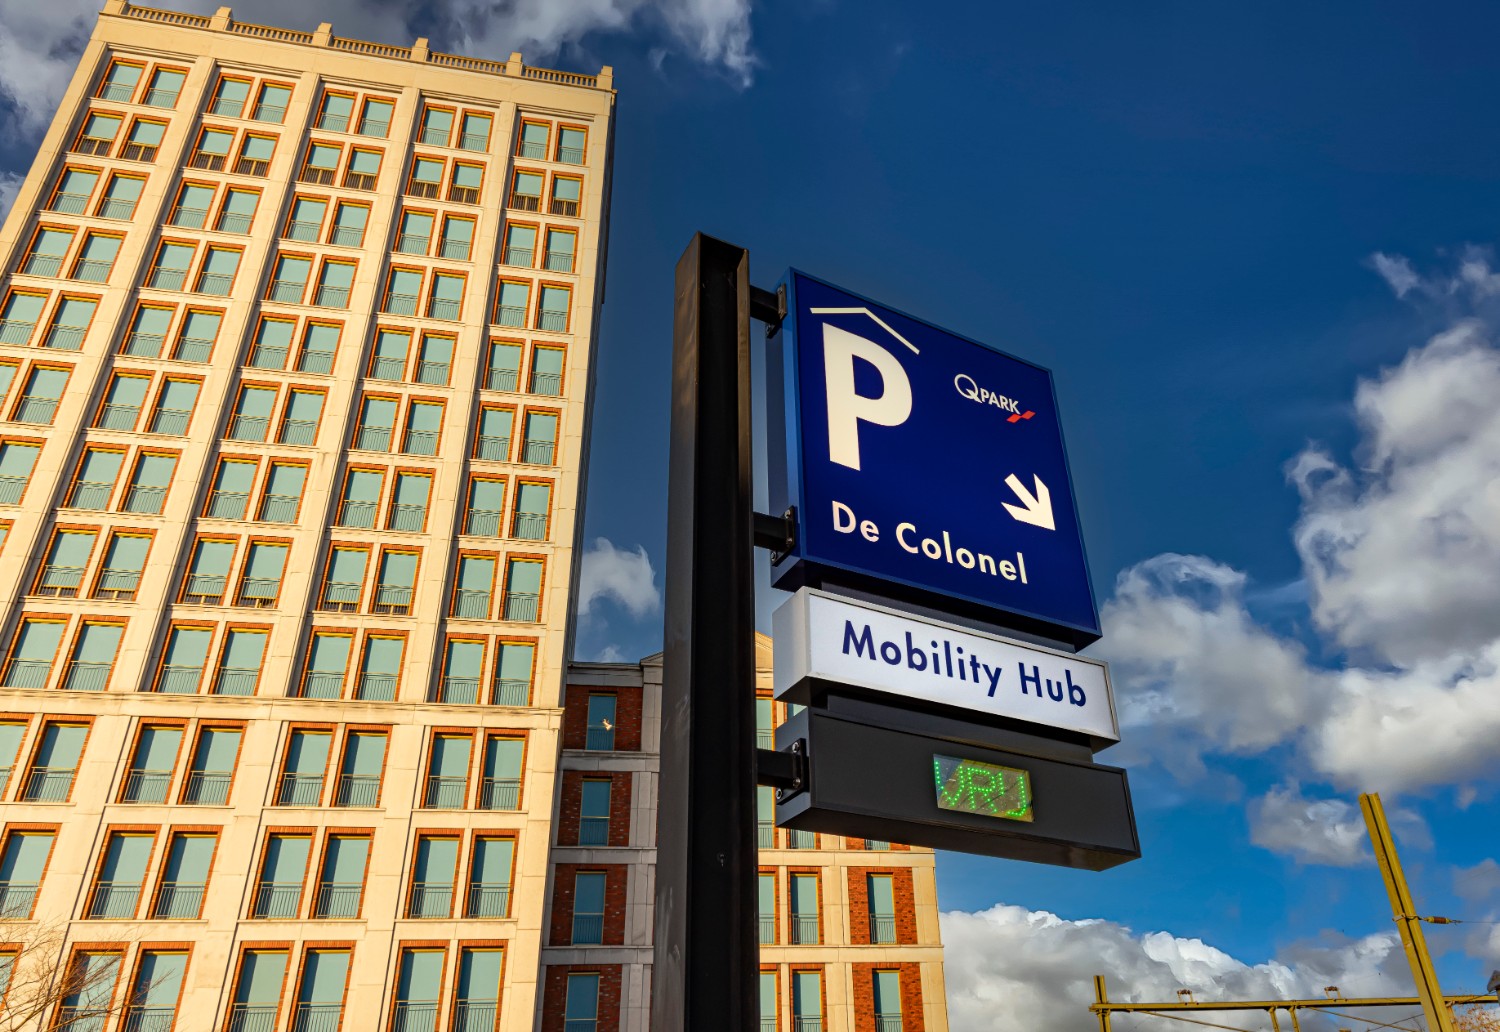
For Q-Park, a Mobility Hub is a parking facility which offers parking for all kinds of vehicles, charging for all kinds of vehicles, booking to transform search traffic to destination traffic, and sharing mobility options such as public transport and/or car and bicycle rental.
Of our defined Mobility Hubs, 52 are recognisable with our Mobility Hub house style. The rest will follow in the years to come.
Figure 2 Q-Park Mobility Hub house style
We also support the electrification of the car fleet by significantly increasing the number of EV charging points installed in our parking facilities. We now have:
398 parking facilities offering EV charging (2024: 261).
9,416 EV charging points (2024: 6,854), an increase of 37%.
In 2025 we facilitated 106.0 million zero-emission kilometres (2024: 77.7) a 36% increase.
Chart 1 Parking facilities offering EV charging
Chart 2 Total EV charging points
The total energy consumed in our operated parking facilities (PFs) amounted to 108.8 GWh compared to 97.0 GWh in 2024, an increase of 12%. The rise can be attributed to our expanded portfolio of operated PFs.
This total excludes the energy consumed by the 7,310 operated EV charging points (2024:4,708 ): 21.2 GWh (2024:16.0 GWh), an increase of 32%. The increase can be attributed to the growth of operated EV CPs in our portfolio and the upsurge in EV charging point usage by our customers.
Chart 3 GWh consumed by operated PFs and CPs
The carbon footprint per operated parking space is much lower compared to 2025.
In 2025, we calculated the average kg CO2 per parking space to be 10.5 (2024: 14.2), a reduction of 26%. This is thanks to the efforts we've made by sourcing on average 76% (2024: 74%) renewable energy for parking facilities and EV charging points.
Since we started measuring our emissions in 2010, we have achieved a 94% reduction in our carbon footprint per parking space.
Chart 4 Average CO2 footprint (kg CO2) per parking space (market based as of 2020)
The following chart shows the greenhouse gas emissions (GHG) per Scope, and the total GHG emissions in tons CO2. The considerable reductions in Scopes 2 and 3 (market based) from 2023 to 2024 are thanks to Q-Park Netherlands sourcing all its electricity from renewable sources and Q-Park France increasing its percentage of renewable energy from 25% to 50%.
Note that the emissions in Scope 3 originate from upstream fuels (tCO2 527), upstream electricity (tCO2 947), transmission and distribution (T&D) losses (tCO2 1,128), EV charging points ((tCO2 629) and business flights (tCO2 64).